Looks like you're located outside the continental United States!
While we can't ship Royal NY Line Up boxes to you through our website, our team of coffee traders will be happy to help place your order and secure the best shipping rates for you.
Please note that if you have other items in your cart such as tea or tickets to an event at The lab, you will not be able to proceed to payment until all 22lb. boxes have been removed from your order
Looks like you're located outside the continental United States!
While we can't ship Royal NY Line Up boxes to you through our website, your coffee trader will be happy to help place your order and secure the best shipping rates for you.
As I would normally do, I review my comments from our previous market watch letter to see what points of emphasis might need to be made. This is to avoid repetition and see if our comments might have proved valuable.
Second Month Continutation Charts:
Technical Analysis of the New York Futures Market Watch:
We have experienced confined market ranges that continue the existing trend since our last report. It's been up five or six cents and then back to unchanged and down for five or six cents. One could certainly guess that comments too may be little changed over the past 3 months. Well, that is in fact the case now in June of 2018.
Once again, we will take a look at two time frames for the purposes of studying chart activity. Weekly gives us a long term analysis and daily enables us to analyze the shorter time frames.
Chart Distinction:
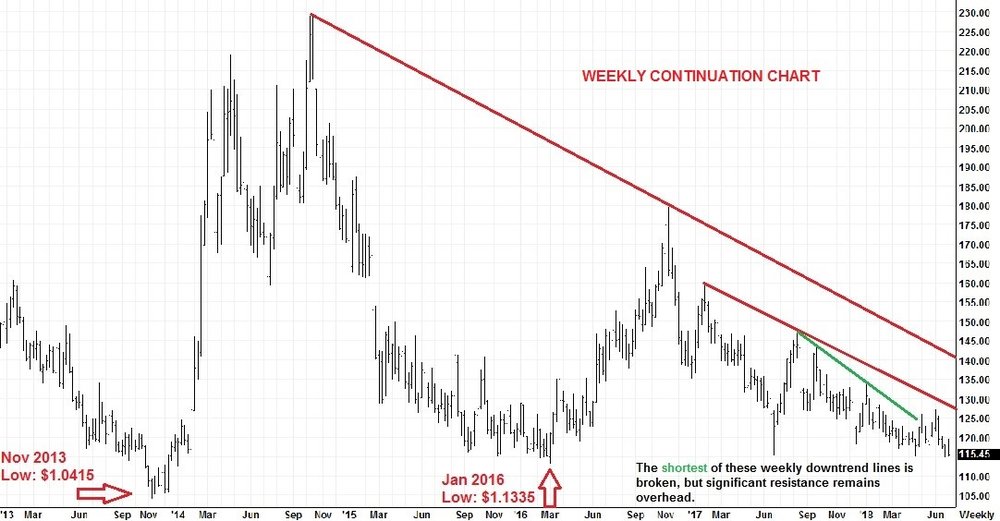
The weekly chart shows a steep and relatively unchallenged down trend line that dates back to late 2014. Currently that resistance is at the $1.4000 area. A more recent downtrend line which began in late 2016 was nearly challenged 6 weeks ago, but remains today at above $1.2500. A secondary line of the previously mentioned 2016 line (mid-2017 to current) had been broken in the recent April to June 2018 rally from the $1.15 area to the $1.27 area. This gives one reason to think the downward momentum is waning.
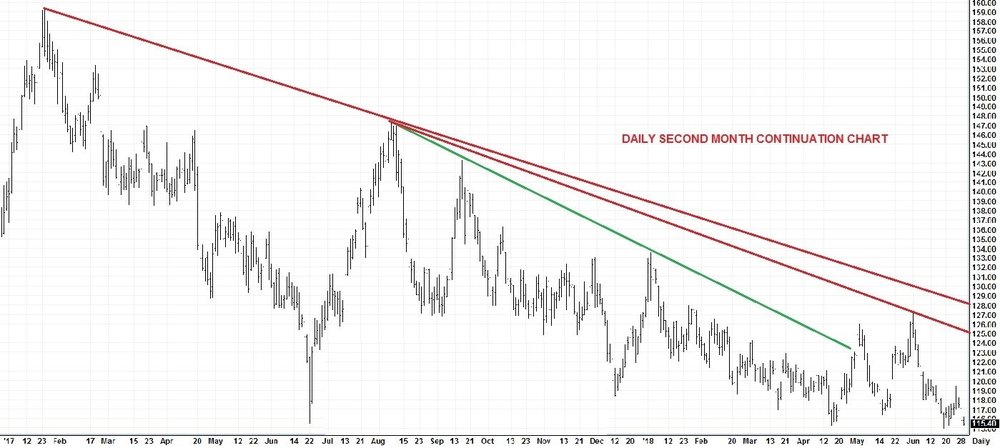
The daily chart shows more detail of the "secondary" price action from the weekly chart. You can see where the mid-2017 to current trend line was broken. It also shows how we had a 12 cent rally off those lows, only to fail to a point where we now have a new low for the move and a life of contract low. TOTAL Open Interest is at an all-time high record. This too may signal satiated positions.
We are approaching the 2016 lows of $1.1335 and potentially the 2013 lows of $1.0415. I maintain that if the roaster is content with profit margins at these levels, extending coverage for another tranche of their coffee needs would be a sensible suggestion.
Supply:
Brazilian diffs continue to be flat. Softening is expected for Q4 2018 differentials as new crop short covering is satisfied. Additionally, farmers will be expected to keep up with 18/19 sales. Brazil is in the market almost daily, but tend NOT to follow the price down and prefer to sell bounces. Colombian farmers are still limited sellers and despite lower prices, differentials are little changed.
I read an article today that one industry source believes there will be 6.6 Million bags of green coffee surplus for the current year. Considering that global consumption is roughly 150 million bags per year, the surplus is pegged at roughly two weeksâ worth of roastings. Something to think about.
Demand:
Roaster interest to extend fixations is apparent, but the beginning of summer, the end of school and the prime vacation time of year do present a less than vibrant market for the buy side. Combine that with the lack of any hard push for prices to escalate supply and demand-wise, has many buyers nibbling or simply taking to the sidelines for now.
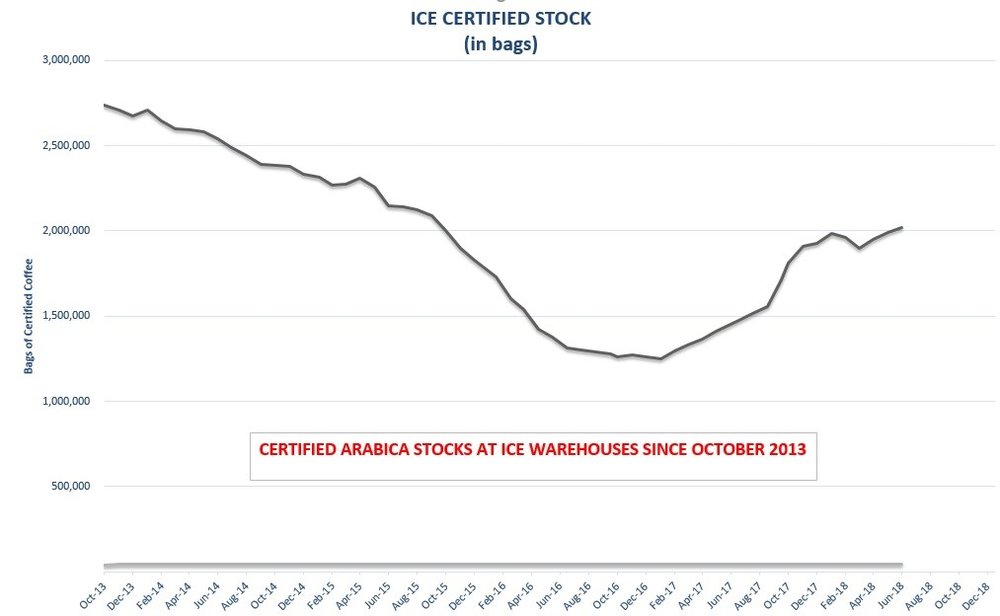
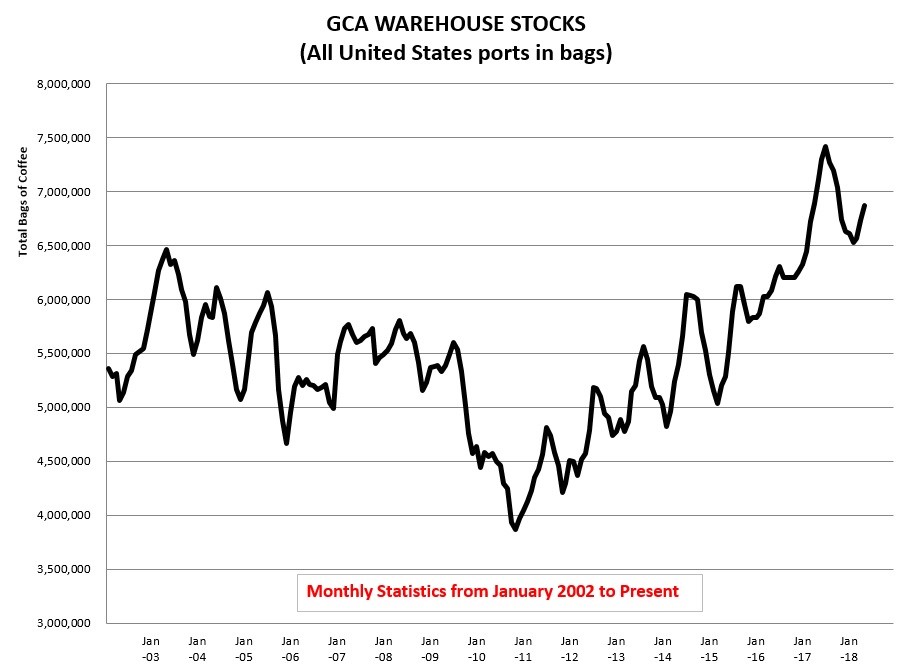
The certified stock number has remained steady being within 50,000 bags of 2.0 million for the past three months.
Once again, this market watch outline is intended to promote thought and an exchange of ideas. If you have an interest to share your point of view, please do not hesitate to contact us.
0.75x
1x
1.25x
1.5x
00:00
As I would normally do, I review my comments from our previous market watch letter to see what points of emphasis might need to be made. This is to avoid repetition and see if our comments might have proved valuable.
Second Month Continutation Charts:
Technical Analysis of the New York Futures Market Watch:
We have experienced confined market ranges that continue the existing trend since our last report. It’s been up five or six cents and then back to unchanged and down for five or six cents. One could certainly guess that comments too may be little changed over the past 3 months. Well, that is in fact the case now in June of 2018.
Once again, we will take a look at two time frames for the purposes of studying chart activity. Weekly gives us a long term analysis and daily enables us to analyze the shorter time frames.
Chart Distinction:
The weekly chart shows a steep and relatively unchallenged down trend line that dates back to late 2014. Currently that resistance is at the $1.4000 area. A more recent downtrend line which began in late 2016 was nearly challenged 6 weeks ago, but remains today at above $1.2500. A secondary line of the previously mentioned 2016 line (mid-2017 to current) had been broken in the recent April to June 2018 rally from the $1.15 area to the $1.27 area. This gives one reason to think the downward momentum is waning.
The daily chart shows more detail of the “secondary” price action from the weekly chart. You can see where the mid-2017 to current trend line was broken. It also shows how we had a 12 cent rally off those lows, only to fail to a point where we now have a new low for the move and a life of contract low. TOTAL Open Interest is at an all-time high record. This too may signal satiated positions.
We are approaching the 2016 lows of $1.1335 and potentially the 2013 lows of $1.0415. I maintain that if the roaster is content with profit margins at these levels, extending coverage for another tranche of their coffee needs would be a sensible suggestion.
Supply:
Brazilian diffs continue to be flat. Softening is expected for Q4 2018 differentials as new crop short covering is satisfied. Additionally, farmers will be expected to keep up with 18/19 sales. Brazil is in the market almost daily, but tend NOT to follow the price down and prefer to sell bounces. Colombian farmers are still limited sellers and despite lower prices, differentials are little changed.
I read an article today that one industry source believes there will be 6.6 Million bags of green coffee surplus for the current year. Considering that global consumption is roughly 150 million bags per year, the surplus is pegged at roughly two weeksâ worth of roastings. Something to think about.
Demand:
Roaster interest to extend fixations is apparent, but the beginning of summer, the end of school and the prime vacation time of year do present a less than vibrant market for the buy side. Combine that with the lack of any hard push for prices to escalate supply and demand-wise, has many buyers nibbling or simply taking to the sidelines for now.
The certified stock number has remained steady being within 50,000 bags of 2.0 million for the past three months.
Once again, this market watch outline is intended to promote thought and an exchange of ideas. If you have an interest to share your point of view, please do not hesitate to contact us.
Looks like you're not logged in! If you have an account, log in here
Don't have an account? Click here to register or close popup window and continue shopping.
You successfully reset your password, please login to your account.
This site uses cookies to allow for proper checkout and order processing; they are not used for any other tracking purposes. By continuing, you accept our use of cookies.